

What Powers Growth When We Stop Burning Things?
I started with a chart: GDP per person across the G7 over the past 25 years. Then I added fossil-fuel consumption per person.
Between 2001 and 2025, every country finished with higher economic output per person and lower fossil-fuel use per person. The lines wandered, dipped and occasionally moved together. Over the whole period, however, they separated.
That raises an interesting question. If we can create more economic value while burning less, what might growth look like when we largely stop burning fossil fuels altogether?
The chart offers a starting point. It leaves quite a lot to explain.
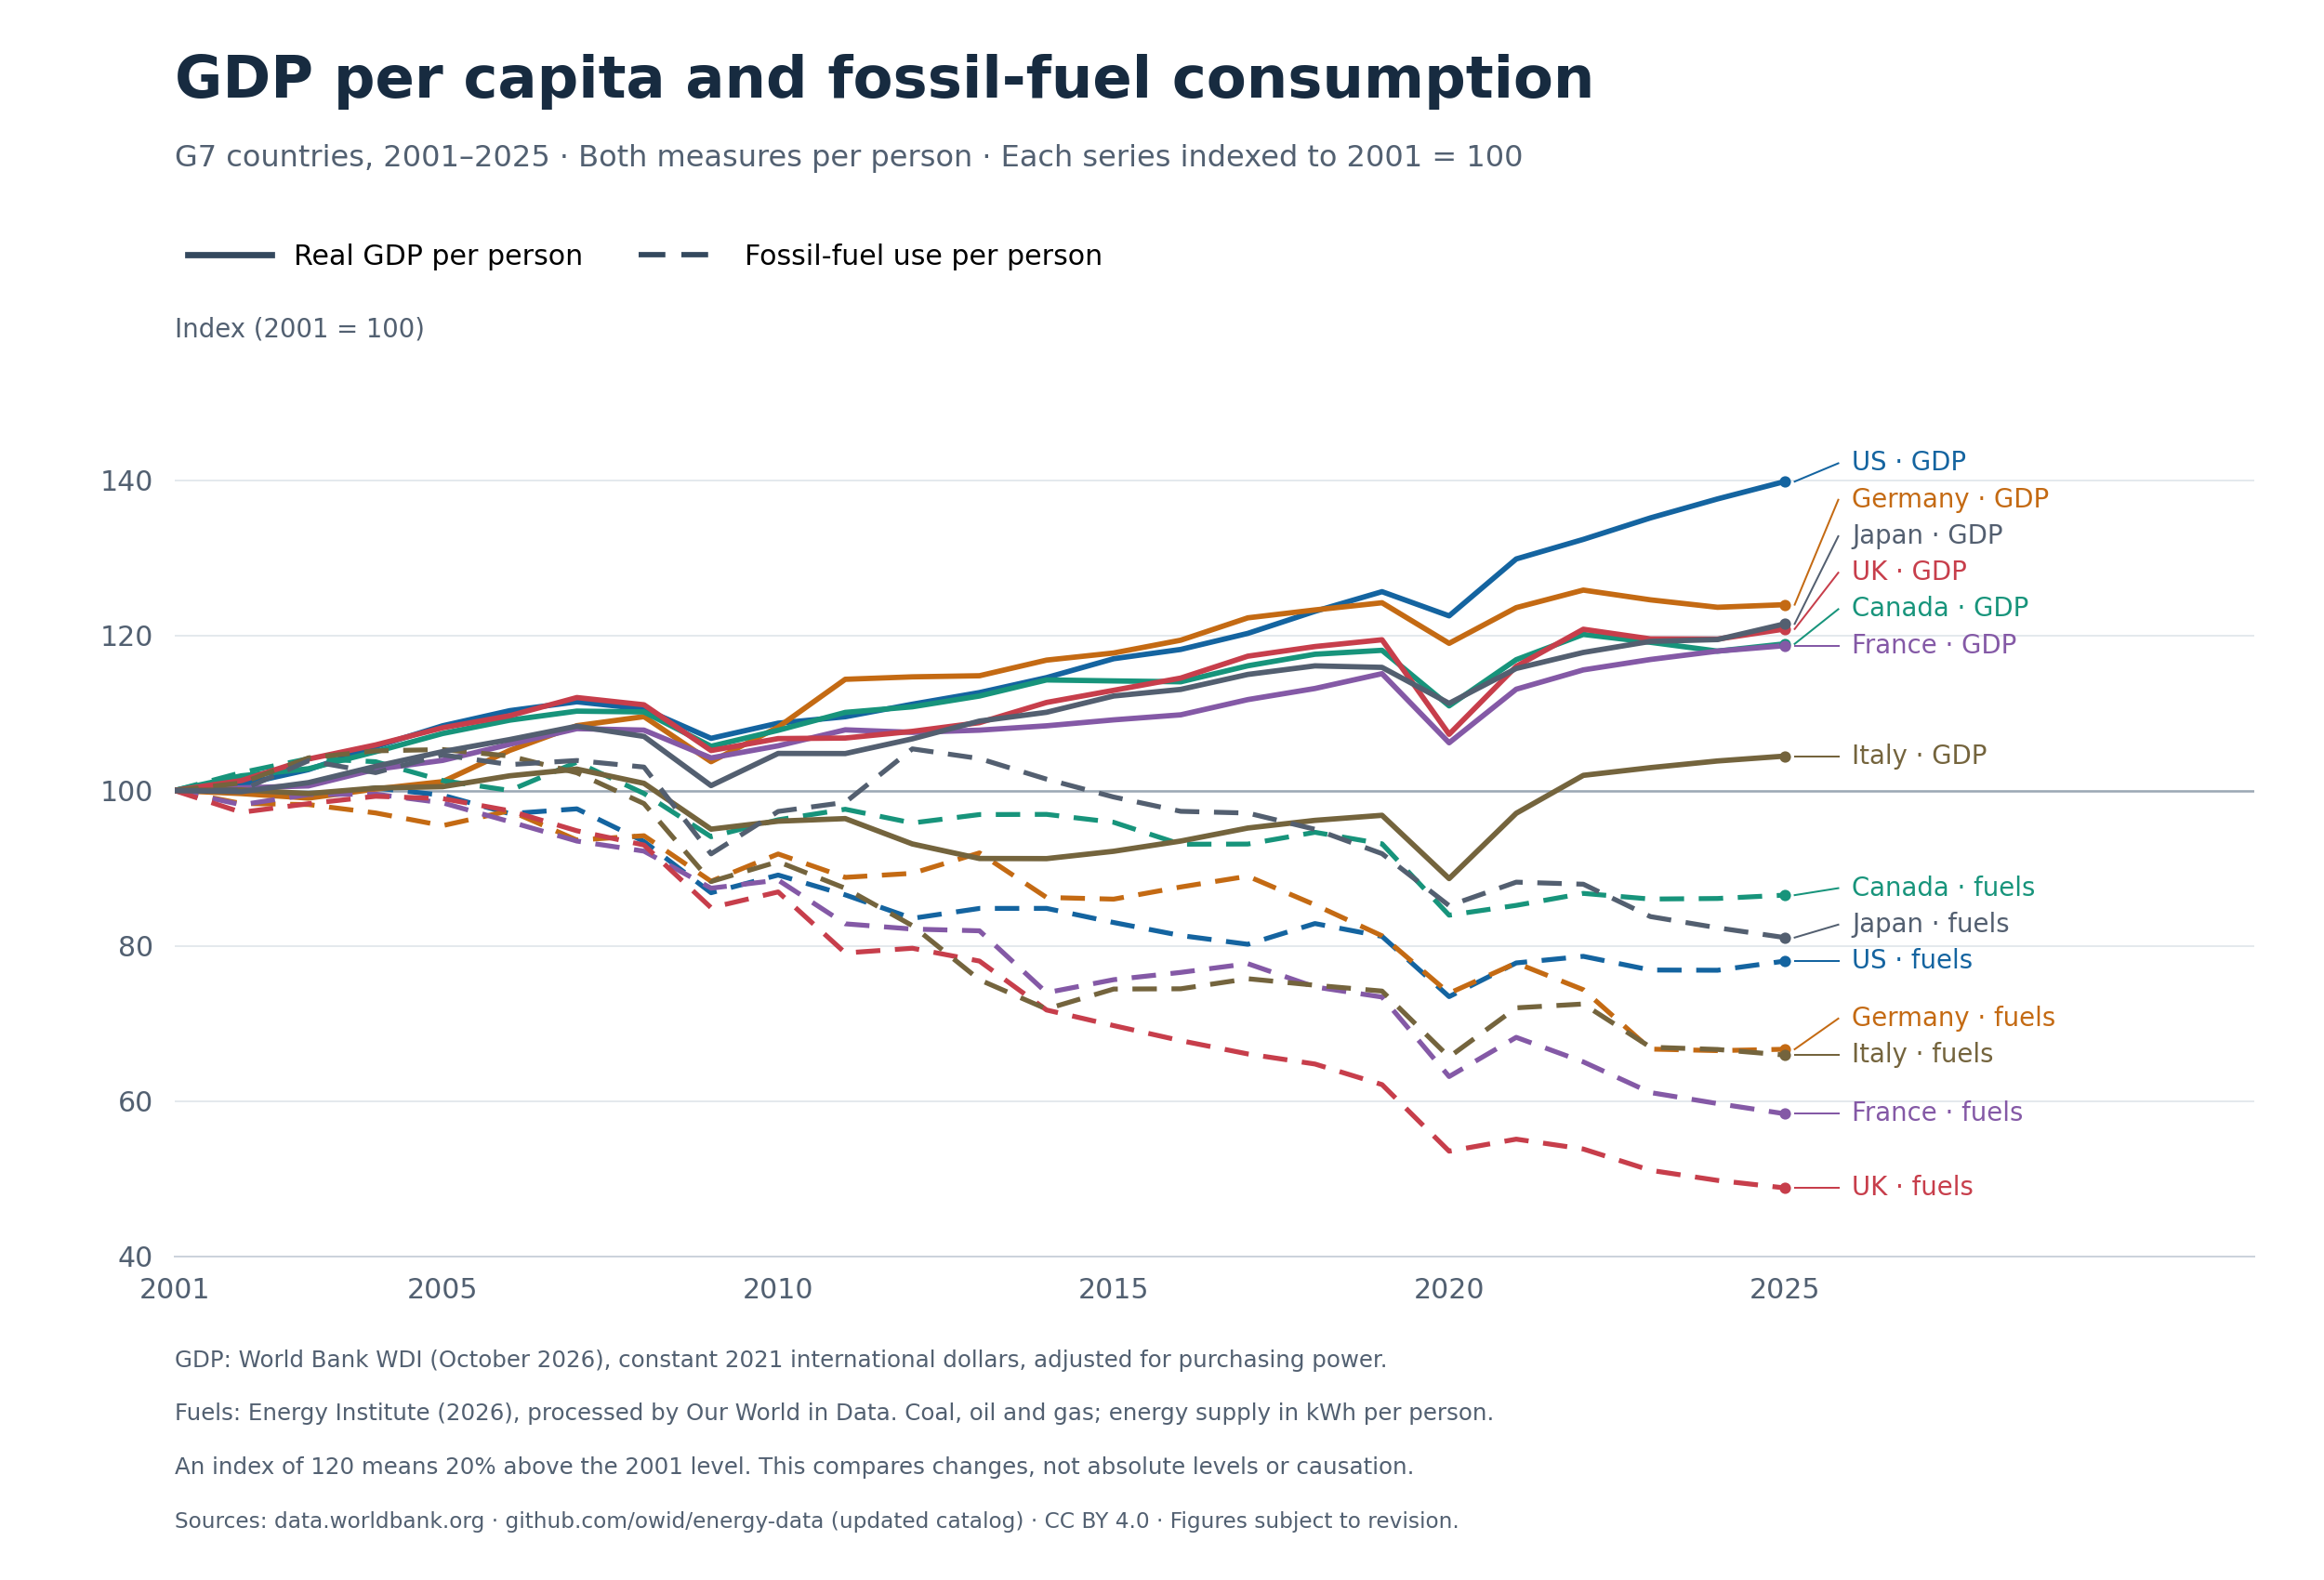
GDP measures the value of economic production. Fossil-fuel consumption measures a physical input. There is a relationship between them, but the amount of fuel required to produce a pound of output can change.
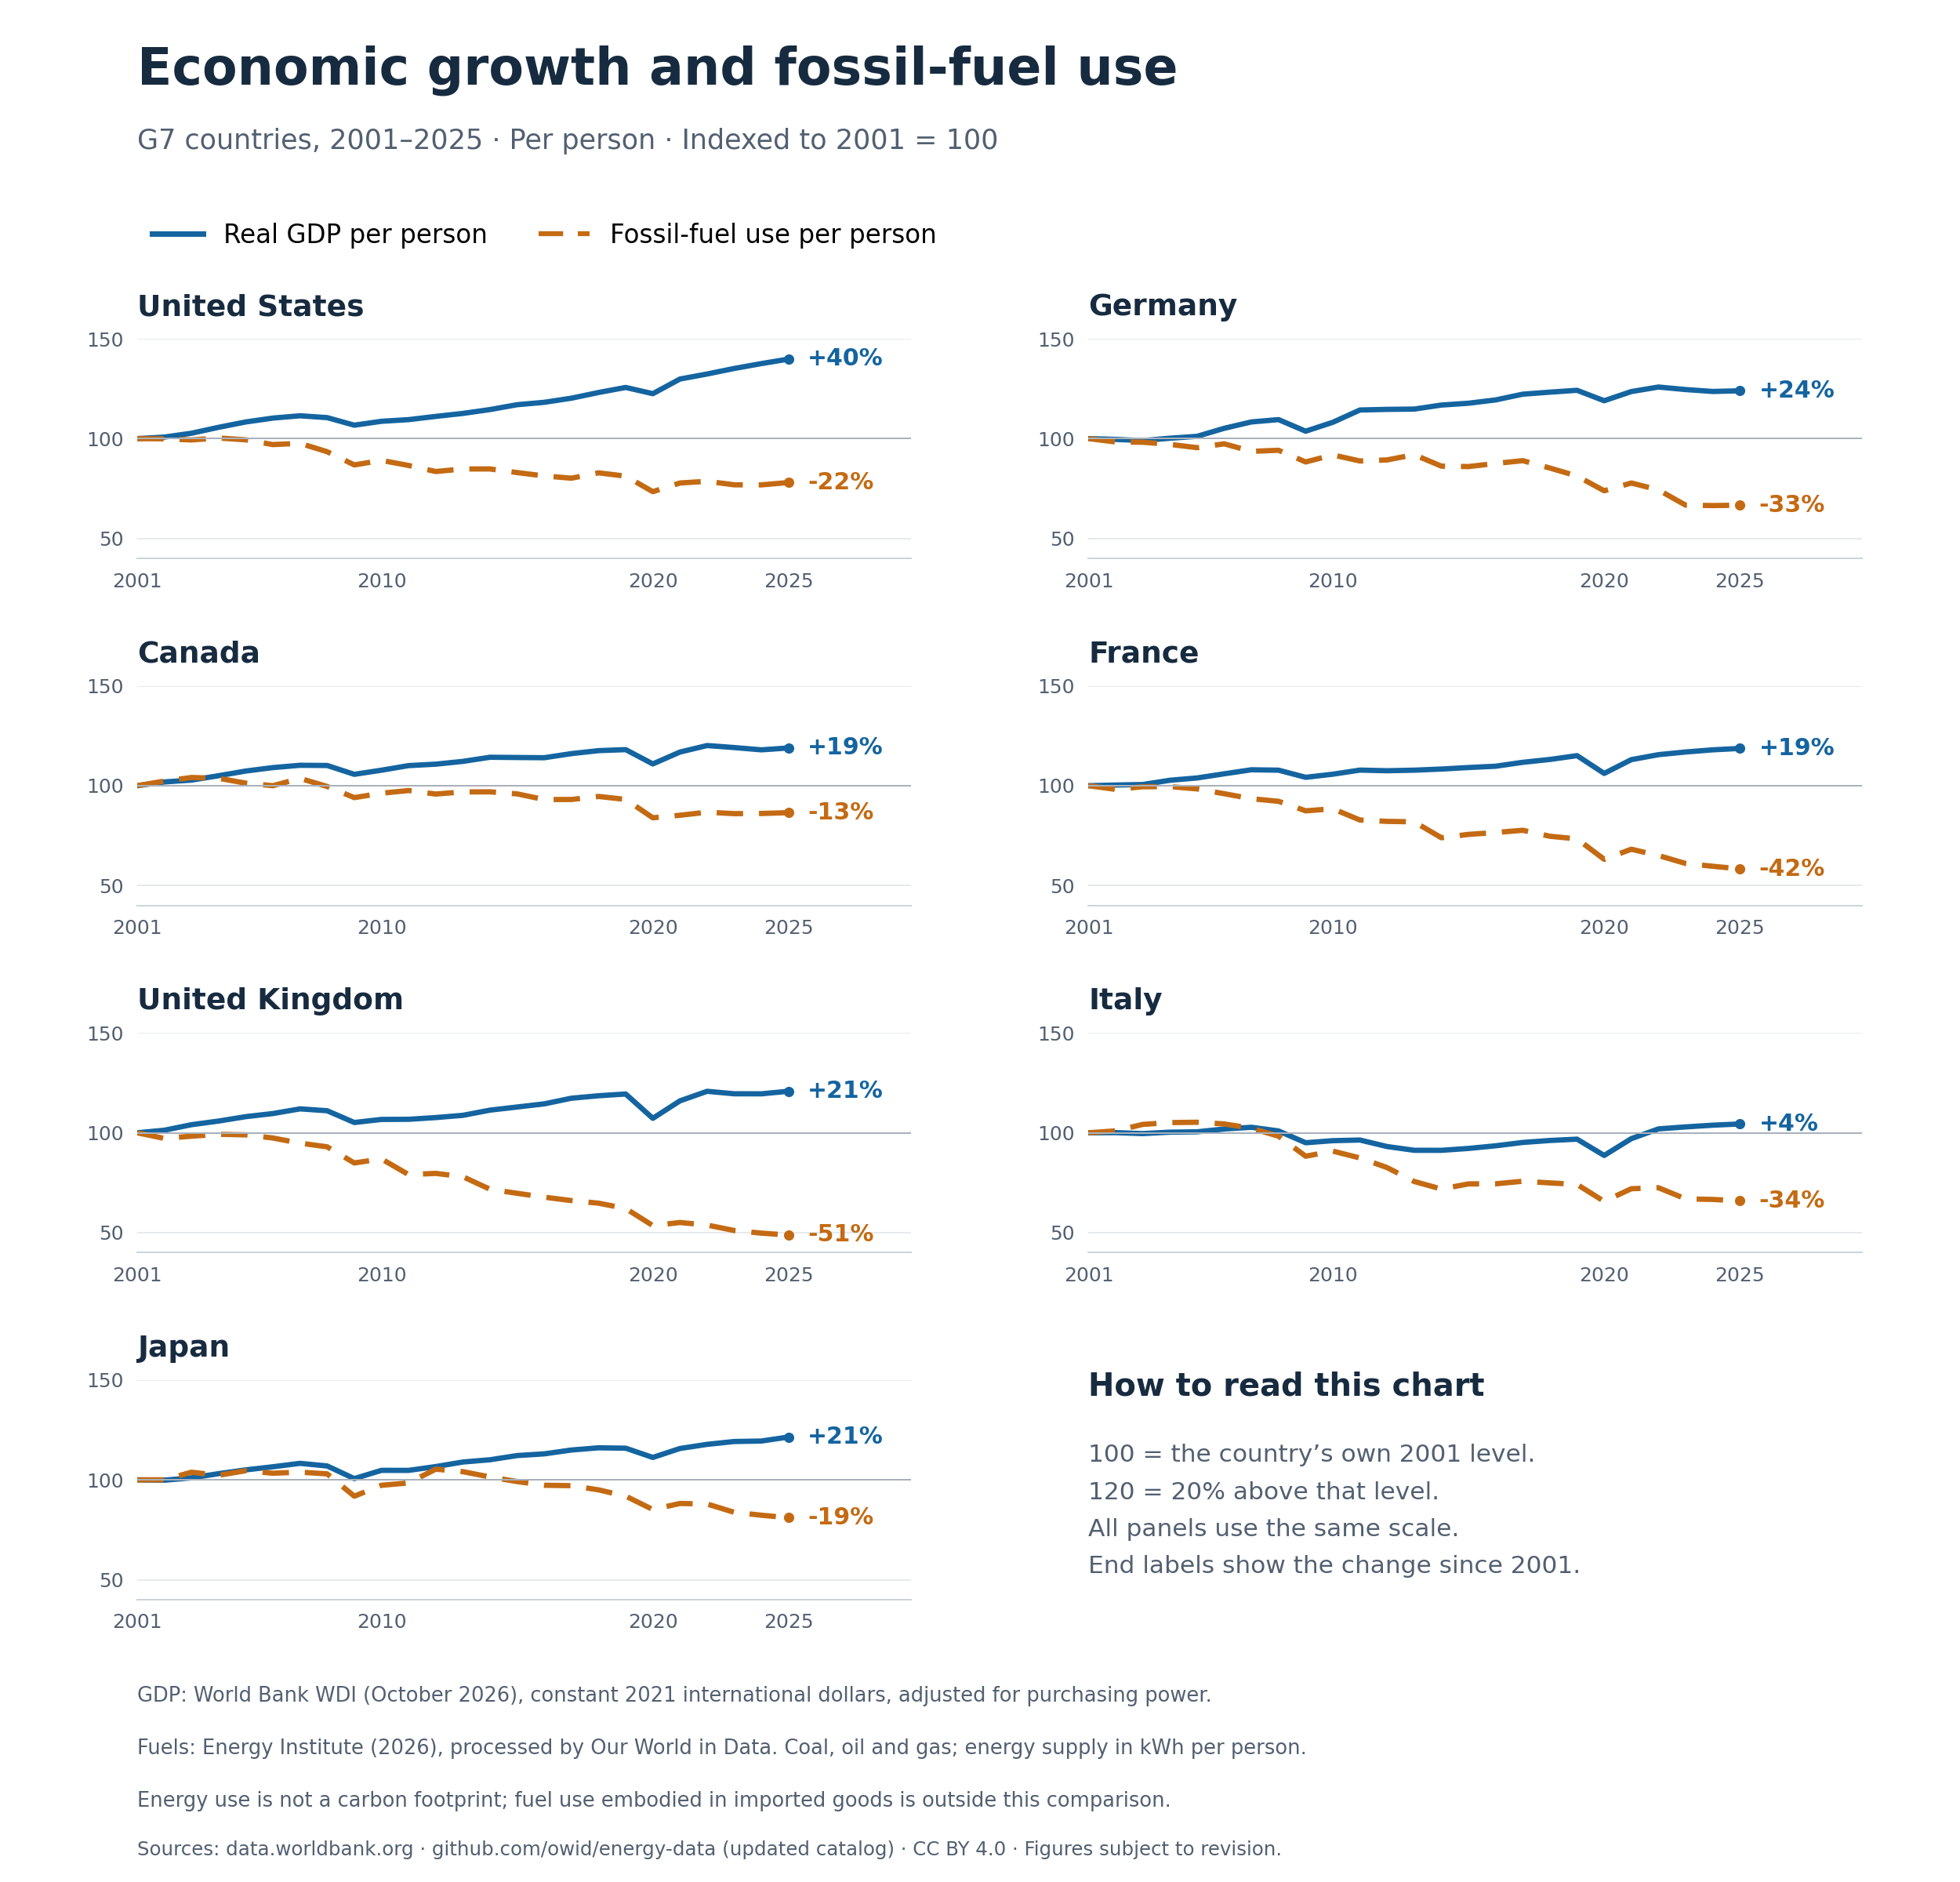
In our comparison, US GDP per person increased by approximately 40%, while fossil-fuel use per person fell by 22%. In the UK, the changes were around +21% and −51%. Italy recorded approximately +4% and −34%. These are calculations from World Bank GDP data and the Energy Institute data processed by Our World in Data.[1][2]
Those differences matter. A substantial fall in fossil-fuel use can accompany modest growth. Stronger growth can accompany a smaller fall. The chart cannot establish that reducing fossil-fuel use caused growth, or that growth caused the reduction.
Some of the explanation lies in efficiency. Better equipment, buildings and processes can produce the same service with less energy. Some lies in the energy supply: electricity generated from wind, solar or nuclear can replace electricity generated by burning fossil fuels. Some lies in what economies produce. An economy with more services and less heavy industry generally needs less energy for each pound of output. UK government analysis identifies both efficiency improvements and changes in industrial activity as contributors to falling energy consumption.[3]
Real GDP already adjusts for inflation. The upward line cannot simply be explained by higher prices. But real economic value can increase through better products, improved processes and more valuable services, without a matching increase in tonnes of fuel.
There are two qualifications to the apparent success story.
The first is population. Our chart compares both measures per person. Canada’s fossil-fuel use per person fell by roughly 13%, while its total use increased by around 11%. More people can offset an improvement in the average. Those calculations come from the same energy dataset.[2]
The second is geography. Closing an energy-intensive factory and importing its products moves some energy consumption elsewhere. A domestic chart will not follow that fuel across the border. ONS research finds that the UK’s historical separation of economic growth from domestic carbon emissions partly reflects changes in trade and industrial structure, alongside improvements in energy generation and efficiency. Carbon emissions and energy consumption are different measures, but the accounting boundary is relevant to both.[4]
We should therefore be precise about what the chart shows: rising real economic output per person alongside falling domestic fossil-fuel use per person. That is evidence of a changing relationship. It is a narrower claim than saying the environmental consequences of growth have disappeared.
The global picture reinforces the distinction. The IEA reports that demand for coal, oil and gas all increased worldwide in 2025. Progress within wealthy economies does not yet amount to a completed global transition.[5]
Still, I think the separation of those lines gives us permission to imagine a different source of growth.
Energy would remain essential. Cleaner manufacturing, public transport, hospitals and digital services all need it. A future with little fossil-fuel use could involve much more electricity. The challenge is to supply useful energy reliably while reducing the damage associated with producing and using it.
One possibility begins with the service we actually want from energy. We want warm homes, useful movement, reliable machinery and comfortable buildings. Burning fuel has been a way of obtaining those services. Technology can change how much energy they require and where it comes from.
A heat pump makes this tangible. It moves heat rather than generating all of it through combustion. The IEA describes current models as three to five times more energy efficient than gas boilers, although performance and running costs depend on the installation, conditions and energy prices.[6]
A warmer home can therefore coexist with lower fuel use. Better insulation can reduce the requirement further. The economic opportunity includes the equipment, installation, maintenance and skills involved, followed by the possibility of lower ongoing resource costs.
That last step is a possibility, rather than a free dividend. Upfront investment has to be financed. Installers need training. Electricity must be available and affordable. A technology that works well in principle can disappoint if the surrounding system is poorly designed.
Which leads to another possibility: growth from building the system that makes cleaner production practical.
Electrifying vehicles, heating and industrial processes requires electricity generation, networks, storage and flexibility. These are substantial engineering and organisational tasks. The IEA’s net-zero pathway treats investment in infrastructure, efficiency and electrification as central requirements, rather than assuming that installing generation alone completes the transition.[7]
My speculation is that countries able to coordinate those investments could gain a productivity advantage. A business with a reliable connection, predictable energy costs and access to the right skills has a stronger basis for investing than one facing years of uncertainty.
Construction would generate activity during the transition. The more durable prize would be infrastructure that helps the wider economy operate effectively for decades. That outcome depends on choosing useful projects and delivering them well. Spending money on infrastructure does not automatically make it productive.
There may also be growth in getting more value from the materials and equipment we already have.
A machine that lasts longer, a building that wastes less heat, or a component that can be repaired all change the relationship between economic benefit and physical throughput. Businesses could earn more from design, maintenance, refurbishment and dependable performance. Households and organisations could redirect some of the money previously lost to waste or avoidable replacement.
This would redistribute activity. Manufacturers selling fewer replacements would face a different market. Repair businesses might expand. Savings might fund new consumption, investment or leisure. There is no guarantee that all these changes add up to higher GDP, and cheaper services can encourage people to use more of them. Efficiency has to be considered alongside total demand.
That makes me interested in prevention as an economic idea.
Consider a building that repeatedly floods, a water system that continually leaks, or a community facing avoidable ill health. Responding generates paid activity. Preventing the problem may reduce some of that expenditure while improving lives and freeing capacity for other purposes.
The productive benefit could be substantial: fewer interrupted working days, more dependable infrastructure and less money committed to recurring failure. But some of the gain may appear as greater wellbeing rather than additional measured output. ONS has long recognised that GDP provides an incomplete account of welfare and the condition of the assets on which prosperity depends.[8]
So a credible vision of growth without fossil fuels needs a broader account of success. It should include what people can afford, the reliability of essential services, their health, and the state of the natural environment, alongside production.
There are physical limits and difficult transitions to face. Cleaner energy infrastructure requires land, materials and manufacturing. Aviation, shipping and some industrial processes present harder challenges than replacing a domestic boiler. Workers and places dependent on existing industries need realistic routes into the next economy. The IEA’s pathways describe major changes in technology, investment and behaviour; they are conditional scenarios, rather than promises.[7]
Indeed, the IEA’s net-zero pathway still includes fossil-fuel use in 2050. Achieving net zero and eliminating every use of fossil fuels are different goals. The final stages of the transition cannot simply be assumed from the progress already made.[7]
The ambition also needs to travel beyond the G7. A strategy built around wealthy countries importing energy-intensive goods cannot explain how the world as a whole becomes less dependent on fossil fuels. The opportunity has to include cleaner manufacturing and reliable energy in the countries producing those goods.
Where does that leave the original question?
My working hypothesis is that future growth could come increasingly from combining cleaner energy with better use of capital, materials, skills and time. More economic value could emerge from dependable infrastructure, useful innovation, healthier people and less avoidable waste. Whether it does will depend on institutions and investment choices as much as individual technologies.
The chart cannot prove that a fully fossil-free economy will grow indefinitely. It does show that the historical relationship is capable of changing.
That seems a useful place to begin: with a practical investigation into how much more prosperity we can create from each unit of energy and material, and how quickly we can replace the fuels carrying the greatest environmental cost.
I would like to see growth judged partly by the problems we stop having to pay for, and by the capacity that releases to do something better.
Data note: The comparison covers 25 annual observations, 2001–2025. GDP per capita is measured in constant 2021 international dollars, adjusted for purchasing power. Fossil-fuel use covers coal, oil and gas, measured as energy supply per person. Each series is indexed to its own 2001 level of 100. The chart compares changes rather than absolute levels. Figures are rounded and subject to revision. Interpretation and future possibilities are the author’s, rather than findings established by the chart.
Sources:
1. World Bank: GDP per capita, PPP, constant 2021 international dollars, October 2026 release.
2. Our World in Data: Energy dataset and documentation, using the updated catalog linked there, incorporating Energy Institute Statistical Review of World Energy (2026). Updated dataset CSV.
3. Department for Energy Security and Net Zero: Energy Consumption in the UK, 2026.
4. ONS: The decoupling of economic growth from carbon emissions: UK evidence, 2019.
5. IEA: Global Energy Review 2026 — Global trends.
6. IEA: The Future of Heat Pumps — How a heat pump works, 2022.
7. IEA: Net Zero Roadmap — Executive summary, 2023.
8. ONS: Beyond GDP — Measuring the economic well-being of individuals, 2017.